Risultati
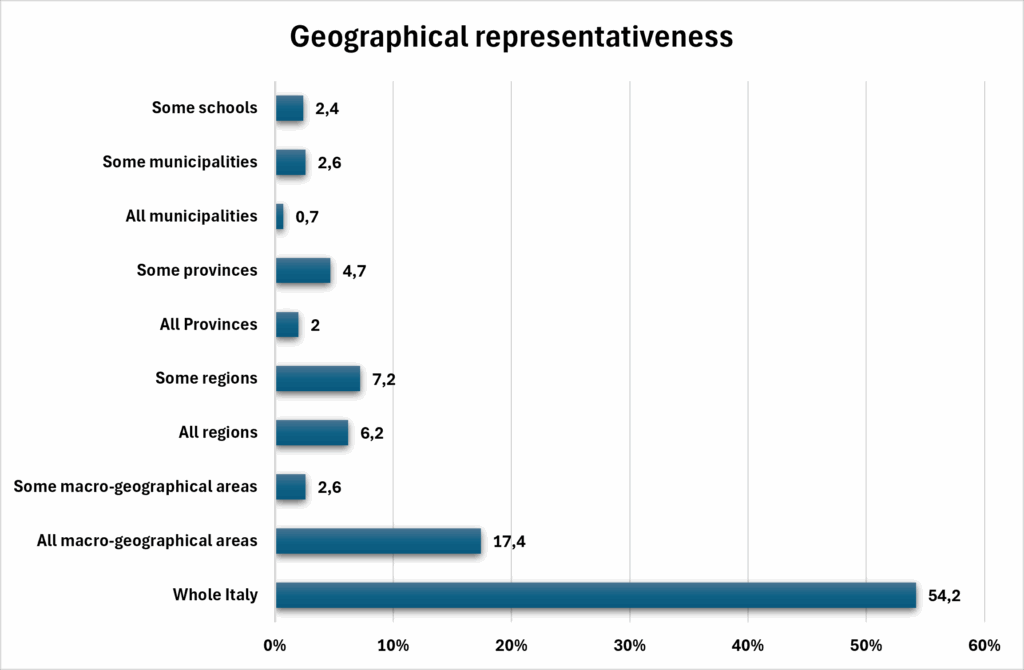
Geographical representativeness
Level of geographical representativeness of the INVALSI data considered in the studies included in the scoping review. The chart shows the different territorial scales used in the literature to describe or analyse INVALSI data: coverage of the whole of Italy without stratification; inclusion of all or some macro-geographical areas; all or some regions (including autonomous provinces); all or some provinces; all or some municipalities; and studies using data referring to individual schools. These categories illustrate the level of territorial detail adopted in the reviewed studies.
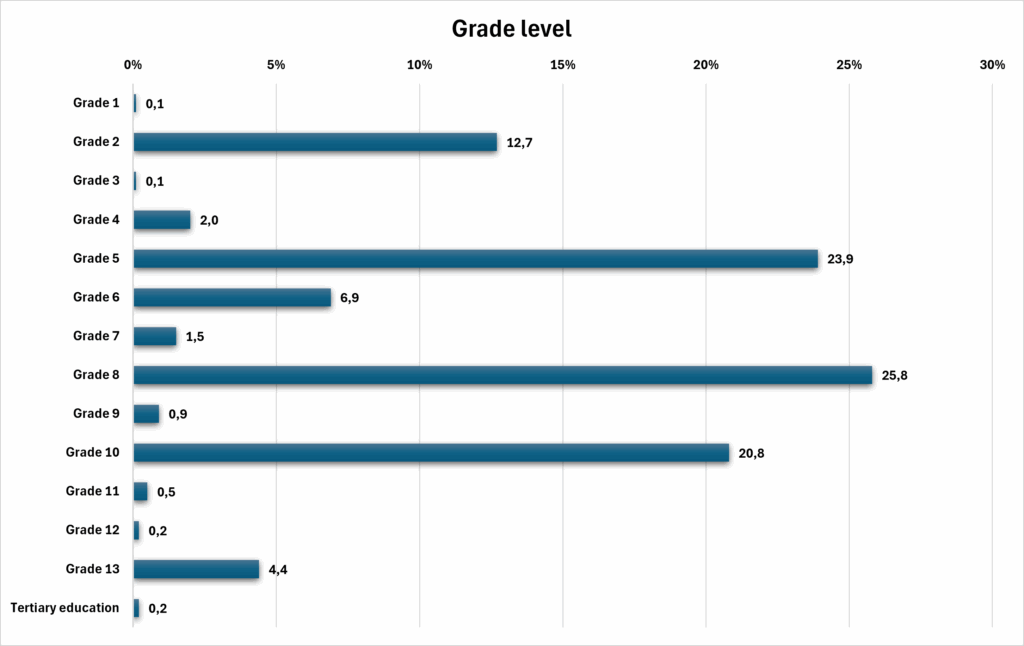
Grade level
Grade level of the INVALSI data considered in the studies included in the scoping review. The chart shows the different grade levels analysed in the literature, from Grade 1 to Grade 13, up to tertiary education. The categories illustrate the educational level of the data used in the reviewed studies.
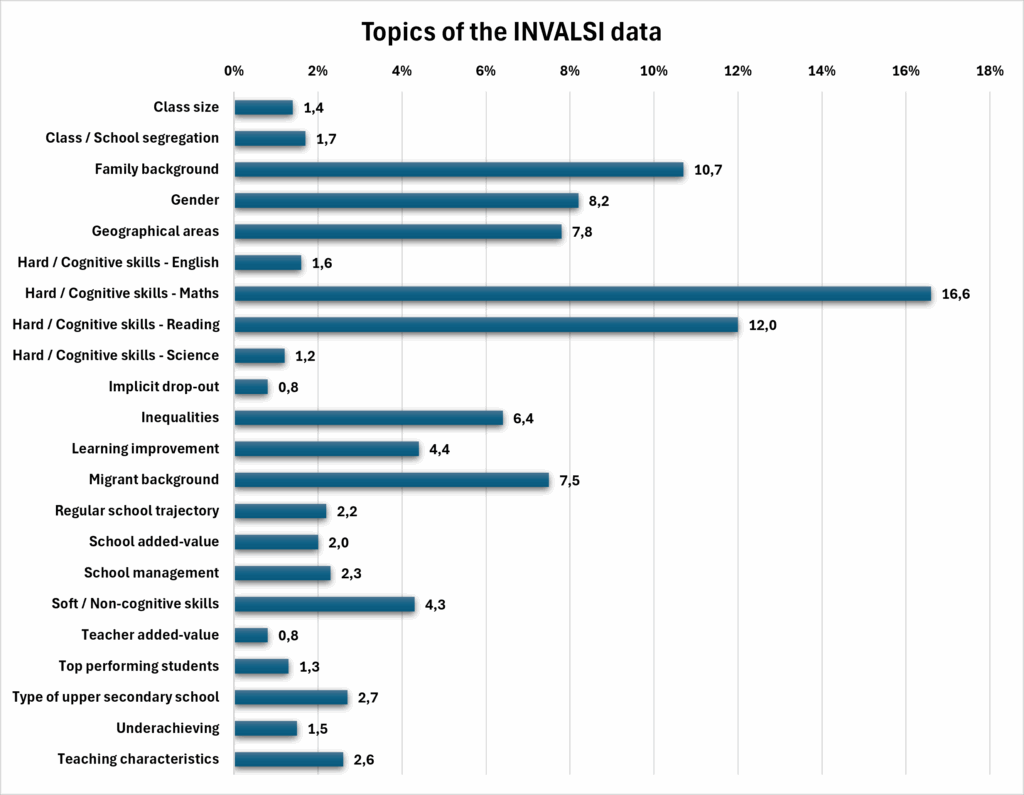
Topics
Topics addressed in the studies included in the scoping review using INVALSI data. The chart shows the main subjects considered and the percentage of studies covering each topic, including: class/school segregation, class size, family background (ESCS), gender, geographical areas, cognitive skills (English, Maths, Reading, Science), implicit dropout, inequalities, learning improvement (all students in the class/school), migrant background, regular school trajectory, school-added value, teacher-added value, school management, non-cognitive skills (civic, socio-emotional, digital, financial), teaching characteristics (didactics, professional development, characteristics), top performing students, type of upper secondary school, and underachieving students. Percentages indicate the proportion of studies addressing each topic.
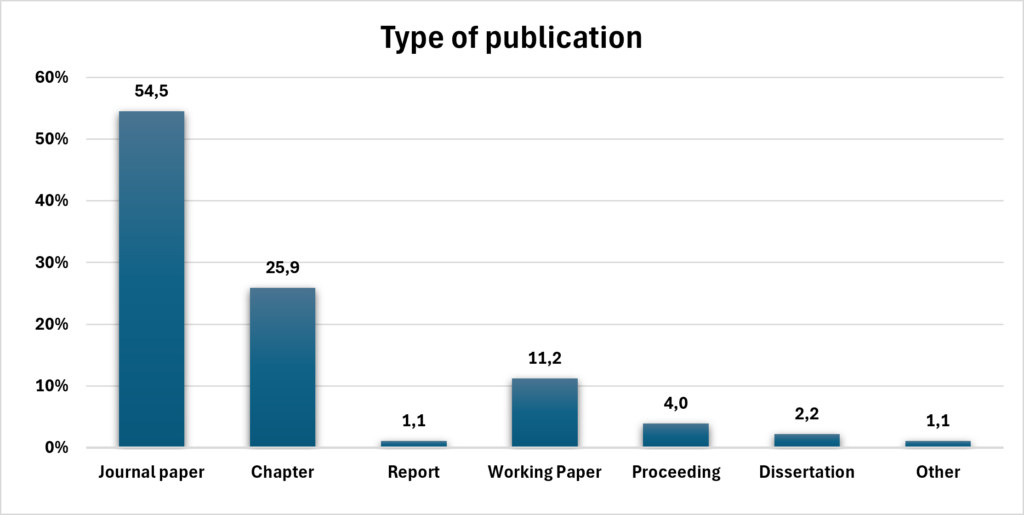
Types of pubblication
Percentage distribution of publication types included in the scoping review. The categories considered include: journal paper, book chapter, report, working paper, proceeding, dissertation, and other types (specify). The chart displays the percentage contributed by each category relative to the total number of selected studies.
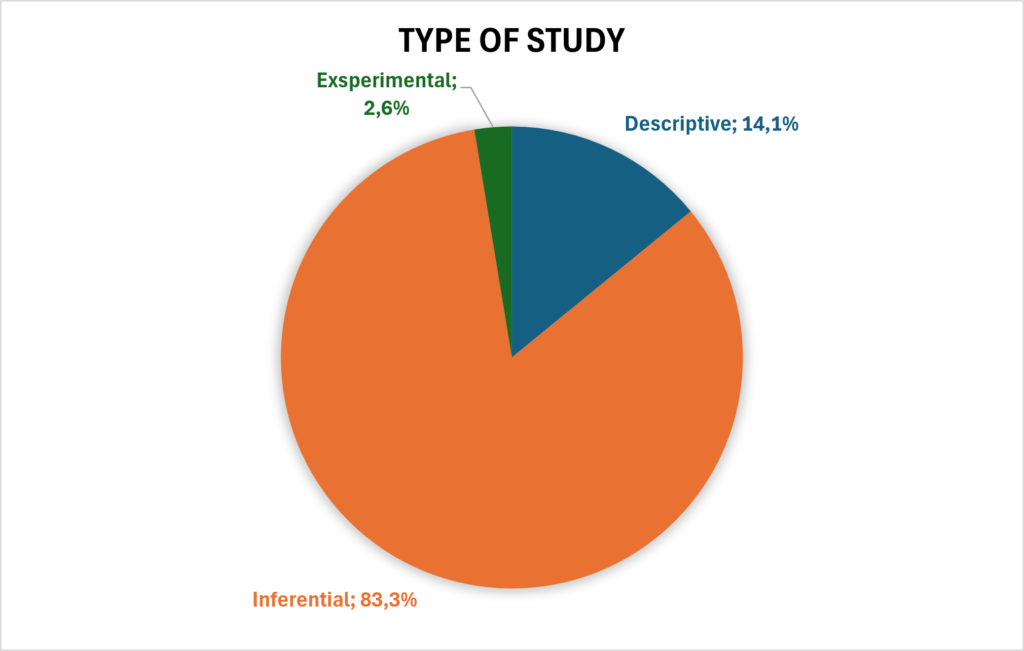
Type of study
Type of studies included in the scoping review using INVALSI data. The chart shows the distribution of studies according to the type of analysis conducted: descriptive studies (merely describing a phenomenon), inferential studies (such as regressions, index construction, predictive models, or machine learning), and experimental studies (randomised and quasi-experimental).
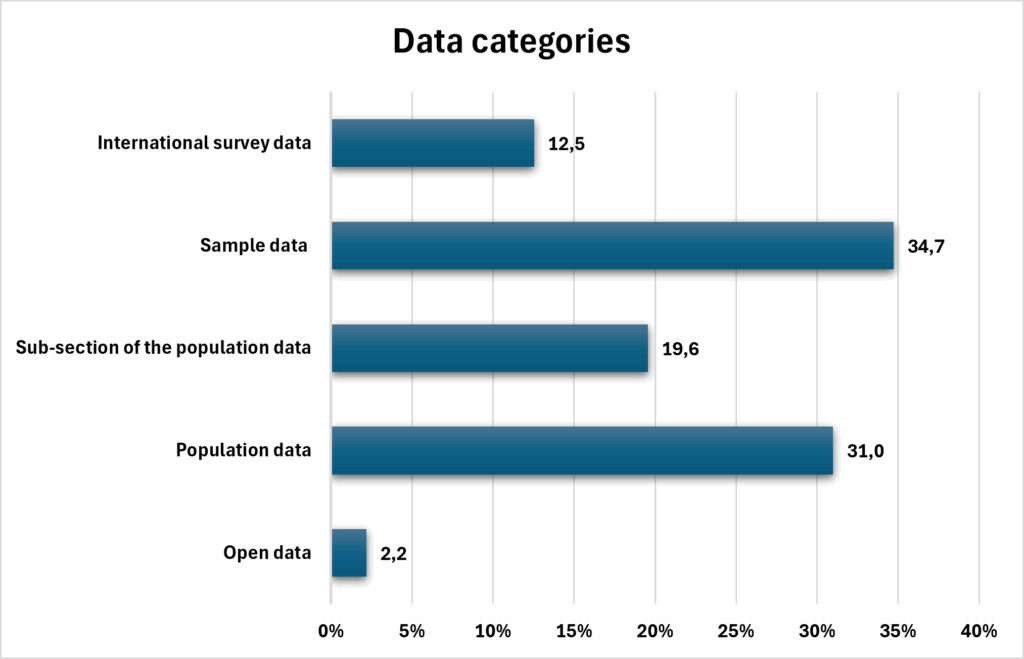
Date categories
Type of INVALSI data used in the studies included in the scoping review. The chart shows the distribution of data according to the following categories: open data, population data, sub-sections of population data (including “ad hoc” requests or microdata), sample data, data from international surveys, and other types of data.
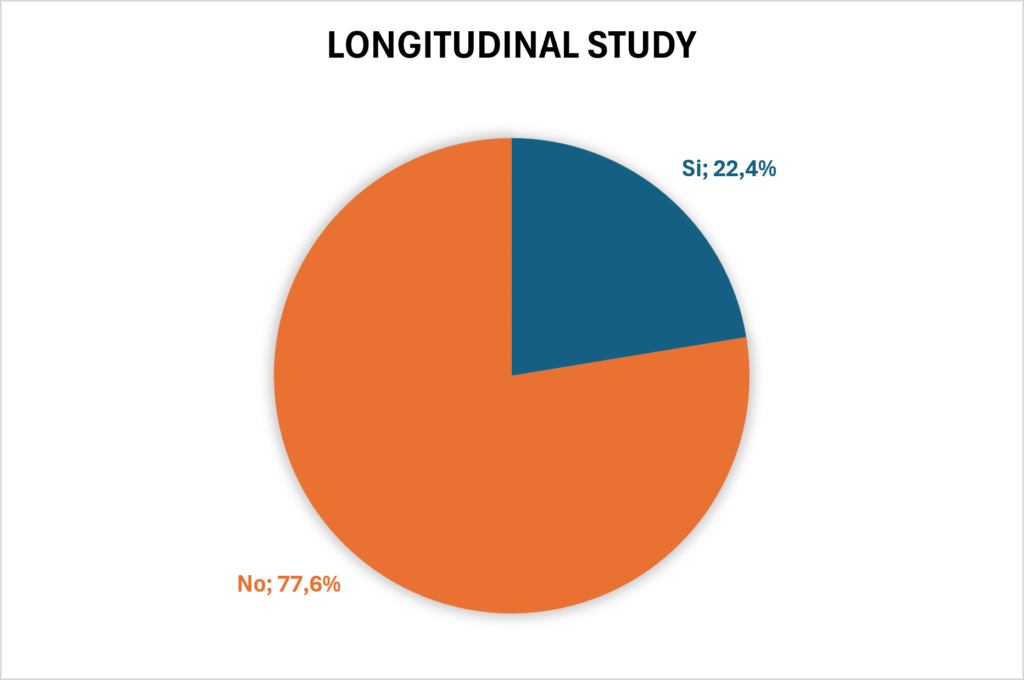
Longitudinal Study
Studies with a longitudinal approach included in the scoping review. The chart shows the distribution of studies with and without a longitudinal approach.
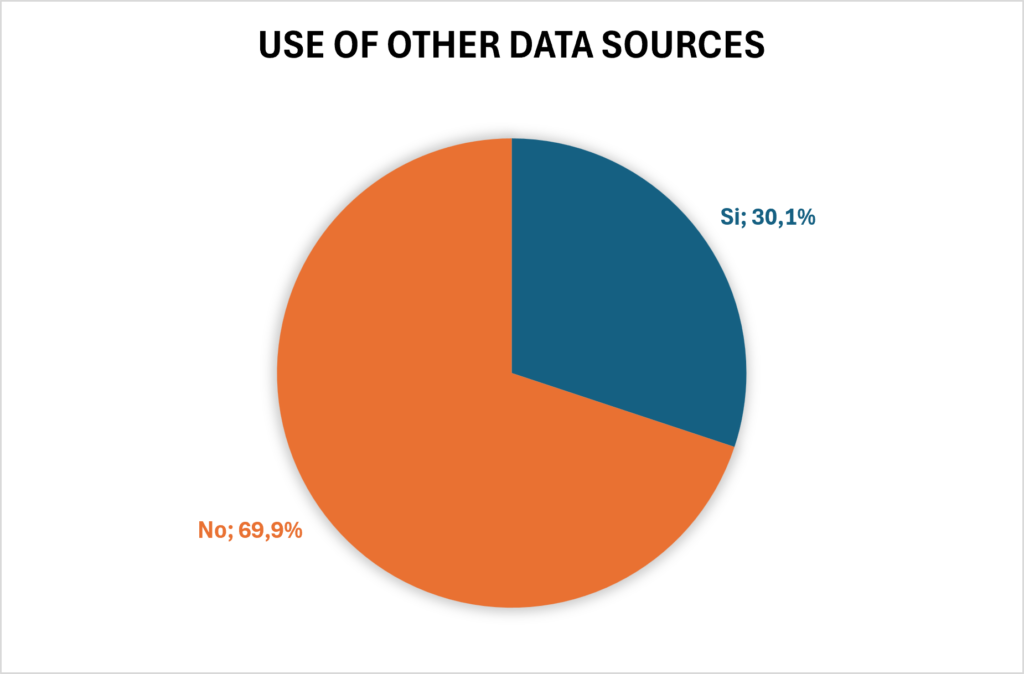
Use of additional data
Use of additional data sources in the studies included in the scoping review. The chart shows whether studies incorporate data beyond INVALSI (yes/no).
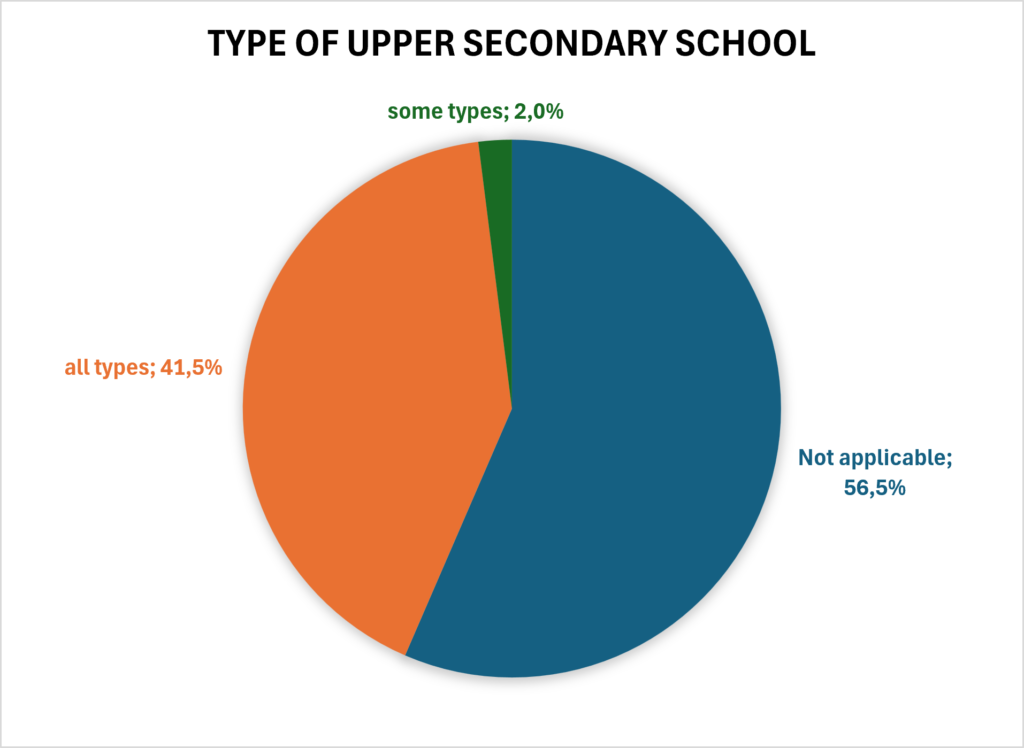
Type of upper secondary schools
Type of upper secondary schools considered in the studies included in the scoping review. The chart shows whether the studies cover all types of upper secondary schools, some types, or if the category is not applicable (e.g., studies focusing on other educational levels).
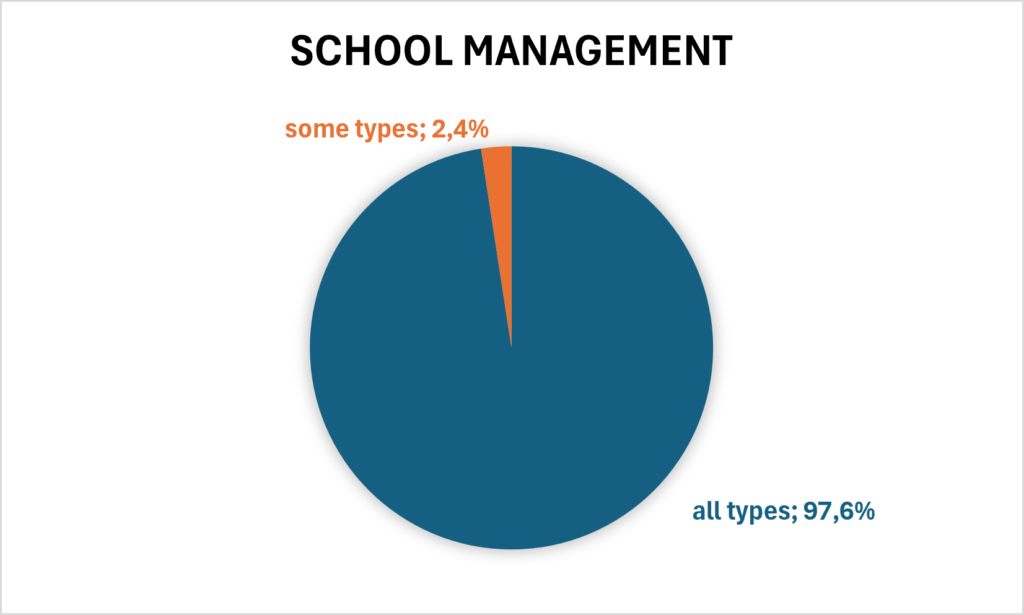
School management
Management of schools considered in the studies included in the scoping review. The chart shows whether INVALSI data refers to public, non-public, or both types of schools.